The Executions menu allows users to view and monitor each process that has been executed. Each time a process runs, a new record with execution details is added to the Executions table, which displays entries in reverse chronological order, from the most recent to the oldest.
How to Access to the Executions Menu
To access to executions:
1. Click the Process menu.
2. Select Executions.
Execution Menu Dashboard
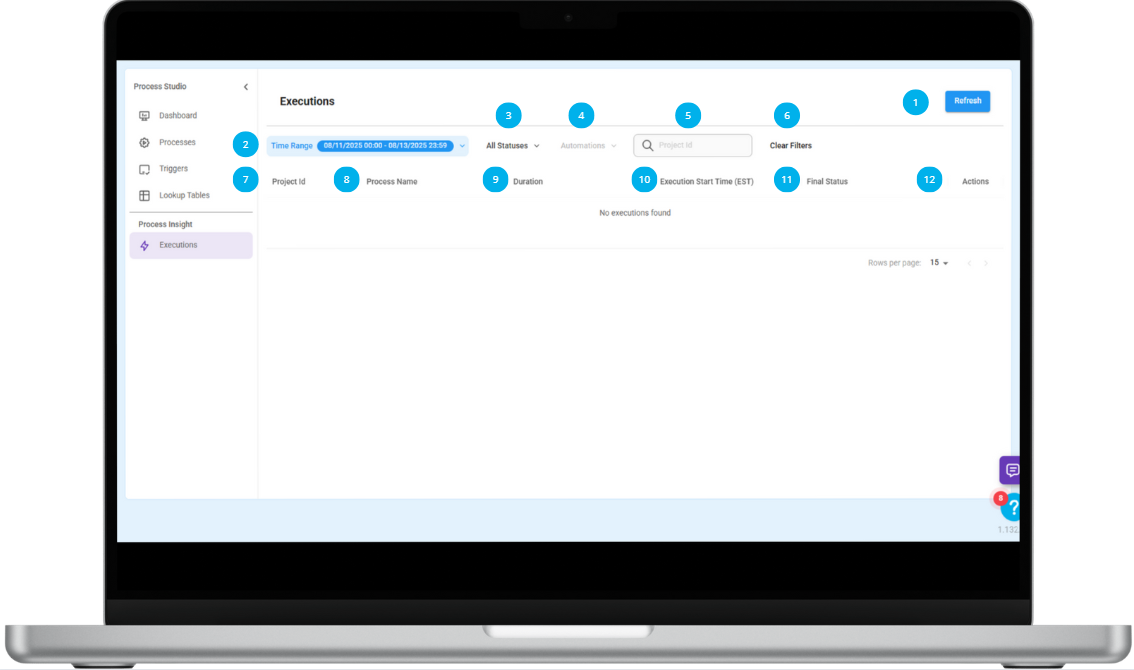
The Execution dashboard provides an informative overview of the key details for each process execution, including its name, execution date, status, and unique ID, along with more details:
|
1. Refresh button. 2. Time Range filter. 3. All Statuses filter. 4. Automations search bar. 5. Project ID search bar. 6. Clear Filters button. |
7. Project ID column. 8. Process Name column. 9. Duration column. 10. Execution Start Time (EST) column. 11. Final Status column. 12. Actions column. |
 Time Range Filter
This filter allows you to view executions that occurred during a specific timeframe. To use the Time Range filter:
1. Click on the Time Range dropdown menu.
2. Select one of the available options:
- Today
- This Week
- This Month
- Select Dates (choose a custom start and end date/time, then click Apply)
The executions that occurred within the selected time period will appear in the table.
All Statuses Filter
This filter allows you to view the process executions based on their final status. There are three possible results:
- All statuses
- Success
- Exception
- Failure
To filter by status:
1. Click the All Statuses dropdown.
2. Select the desired status (Success, Exception, or Failure)
The table will only show the executions with the selected outcome.
Filter by Automation Name
You can search for specific processes by their automation names. To filter by automation name:
1. Click the Automations dropdown.
2. Type the name in the search bar.
3. Select the automation from the list.
Matching results will be automatically shown on the table.
Search by Project ID
You can also filter executions based on the Filevine Project ID of the Trigger (if it contains one). To search by Project ID:
1. Click into the Project ID search bar.
2. Enter the ID of the project you want to review.
Executions linked to that project will be displayed.
Clear Filters
To reset all filters and display the complete list again, just click the Clear Filters button. This removes any applied filters and reloads the full execution history.
Understand Table Columns
Each row in the Executions table represents a single process run, and it includes the following columns:
| Column | Description |
| Project ID | Displays the Filevine Project ID where the process was triggered. |
| Process Name | The name of the automation/process that was executed. |
| Duration | The total time the process took to complete. |
| Execution Start Time (EST) | The date and time the process started running. |
| Final Status | Indicates the result: Success, Exception, or Failure. |
| Actions | Allows you to view the full execution details in JSON format. |
View Execution
The View Execution feature allows you to inspect the technical details of any execution, including statuses, raw JSON data, and process details. This analyzes performance, troubleshoot errors, and review process configurations.
Steps to check an execution:
1. Locate the row of the execution you want to inspect.
2. In the Actions column, click the View icon.
View Execution Dashboard
When you open the execution, the dashboard displays the following details:
|
1. Execution name, Started At, and Final Status. 2. Trigger access button. 3. Process and Exception button. |
4. Process and Exception button. 5. Process Details board. |
View Execution Walkthrough
This will walk through the View Execution step by step, exploring each field, button, and tab so you understand how to review, edit, and troubleshoot an execution.
Here's an interactive tutorial

- Execution name, Started At, and Final Status.
It shows the name of the execution, the date and time when the execution began and the result of the execution (e.g., completed, failed).
Clicking on the execution name will redirect you to the Process Studio Editor where you can edit the name.
- Trigger Access Button
This opens the trigger configuration related to this execution.
Click on it to open the Trigger Editor. The trigger will be displayed there.
- Process and Exception Path
A Process path is your actual automation, it runs step by step whenever the trigger occurs. This means the process is always ready to run when triggered, and it will show up as active. If something causes the process to fail, the Exception path will activate automatically.
The Exception path is a customizable workflow that allows you to set the steps that fit your needs.
For example: It could send an email to the user, notifying them that the process has failed and explaining the reason for the failure.
- Raw JSON Tab
This tab displays the execution’s technical details in JSON format, allowing you to review the data processed during execution.
- Process Details Tab
This tab provides a detailed view of the process inside the Process Studio editor:
1. Click on a node to show two panels:
- Left panel – Shows the JSON exactly as the function receives it, reflecting the real data input.
- Right panel – Shows the node’s configuration as defined in the interface.